 Total Control Settings
At the heart of AnalysTick is a vast array of customization option. This is aimed at making sure you fine tune the app to your needs, exactly the way you want it to show your data in the most efficient and impactful way
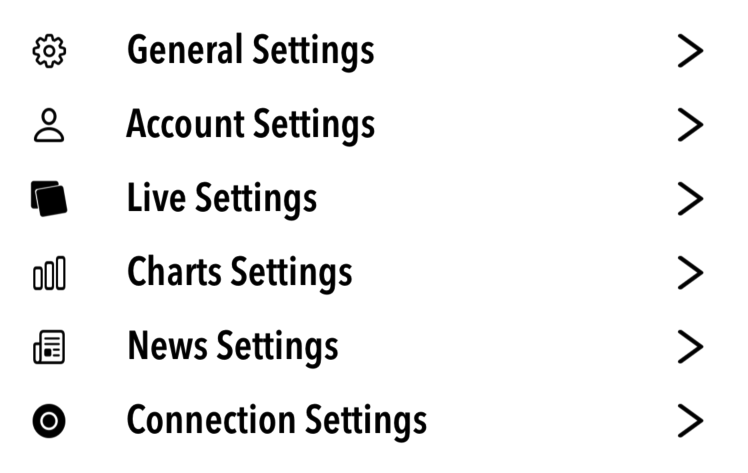
The settings section allows you to customize each aspect of the app. Any view of the app can be tailored to your need by accessing its dedicated settings page and you can also decide the way your communications settings behave (websockets and API calls)
Any change you make is immediately saved in your configuration file and reflected immediately in the app

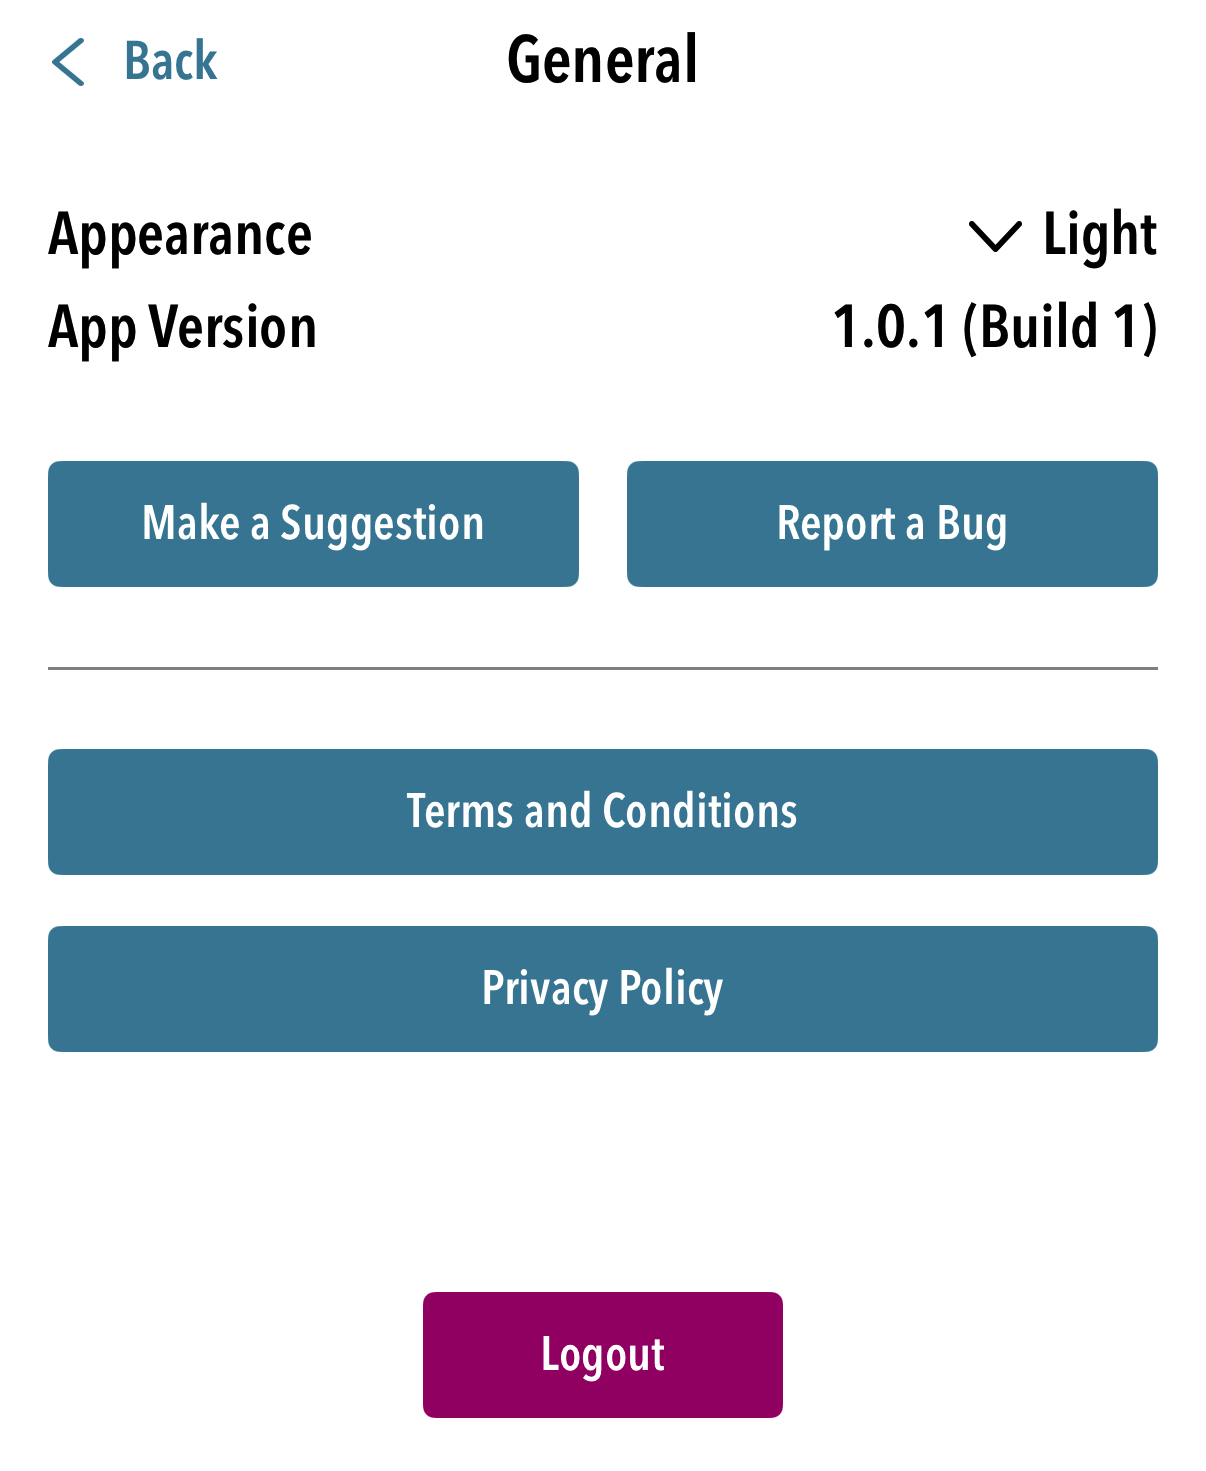
Appearance
Set the display mode for the app:
Light: runs the app in Light mode, regardless of the device settings
Dark: runs the app in Dark mode, regardless of the device settings
Auto: follows the scheme chosen in the device settings
App Version
Displays the current app version. We do recommend to always update to the latest version
Make a Suggestion
Allows you to send us your feedback for improvements or additions to the app
Report a Bug
Use it to report a bug in the app so we can work to solve it. Please describe it in a way that can be replicated
Terms and Conditions
Will show a page with the current Terms and Conditions
Privacy Policy
Will show a page with the current Privacy Policy
Log Out
Logs you out of the app

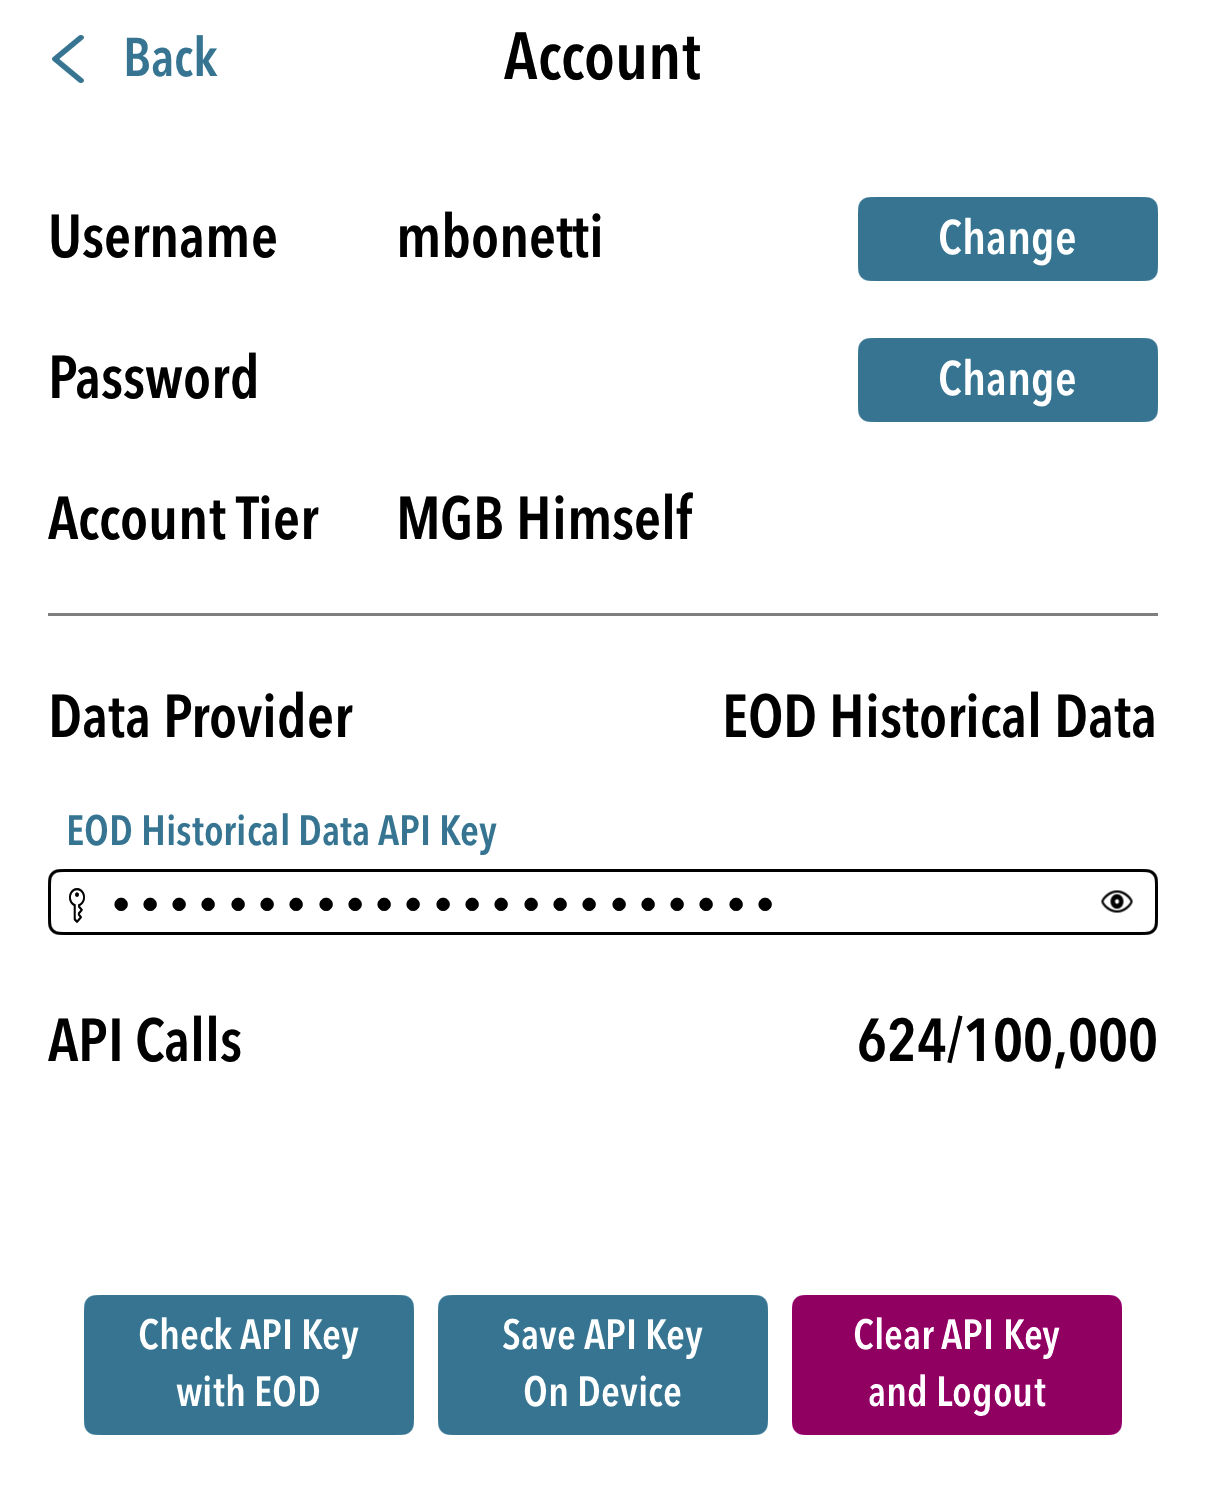
Username
Change your username
Password
Change your password
Account Tier
Check and upgrade your subscription. This will take you to the page with the current subscription tiers where you can upgrade your subscription
Data Provider
Shows your current data provider for all the data in the app
API Key
Shows your current API Key for the data provider. Make sure this is the current one and update it on changes. The API Key is stored on your device only
Check API Key With Provider
Checks that the API Key is valid by testing it with the data provider
Save API Key On Device
Saves the API Key on your device. The API Key is never saved or stored on our servers
Clear API Key and Log Out
Removes the API Key from your device and logs you out of the app

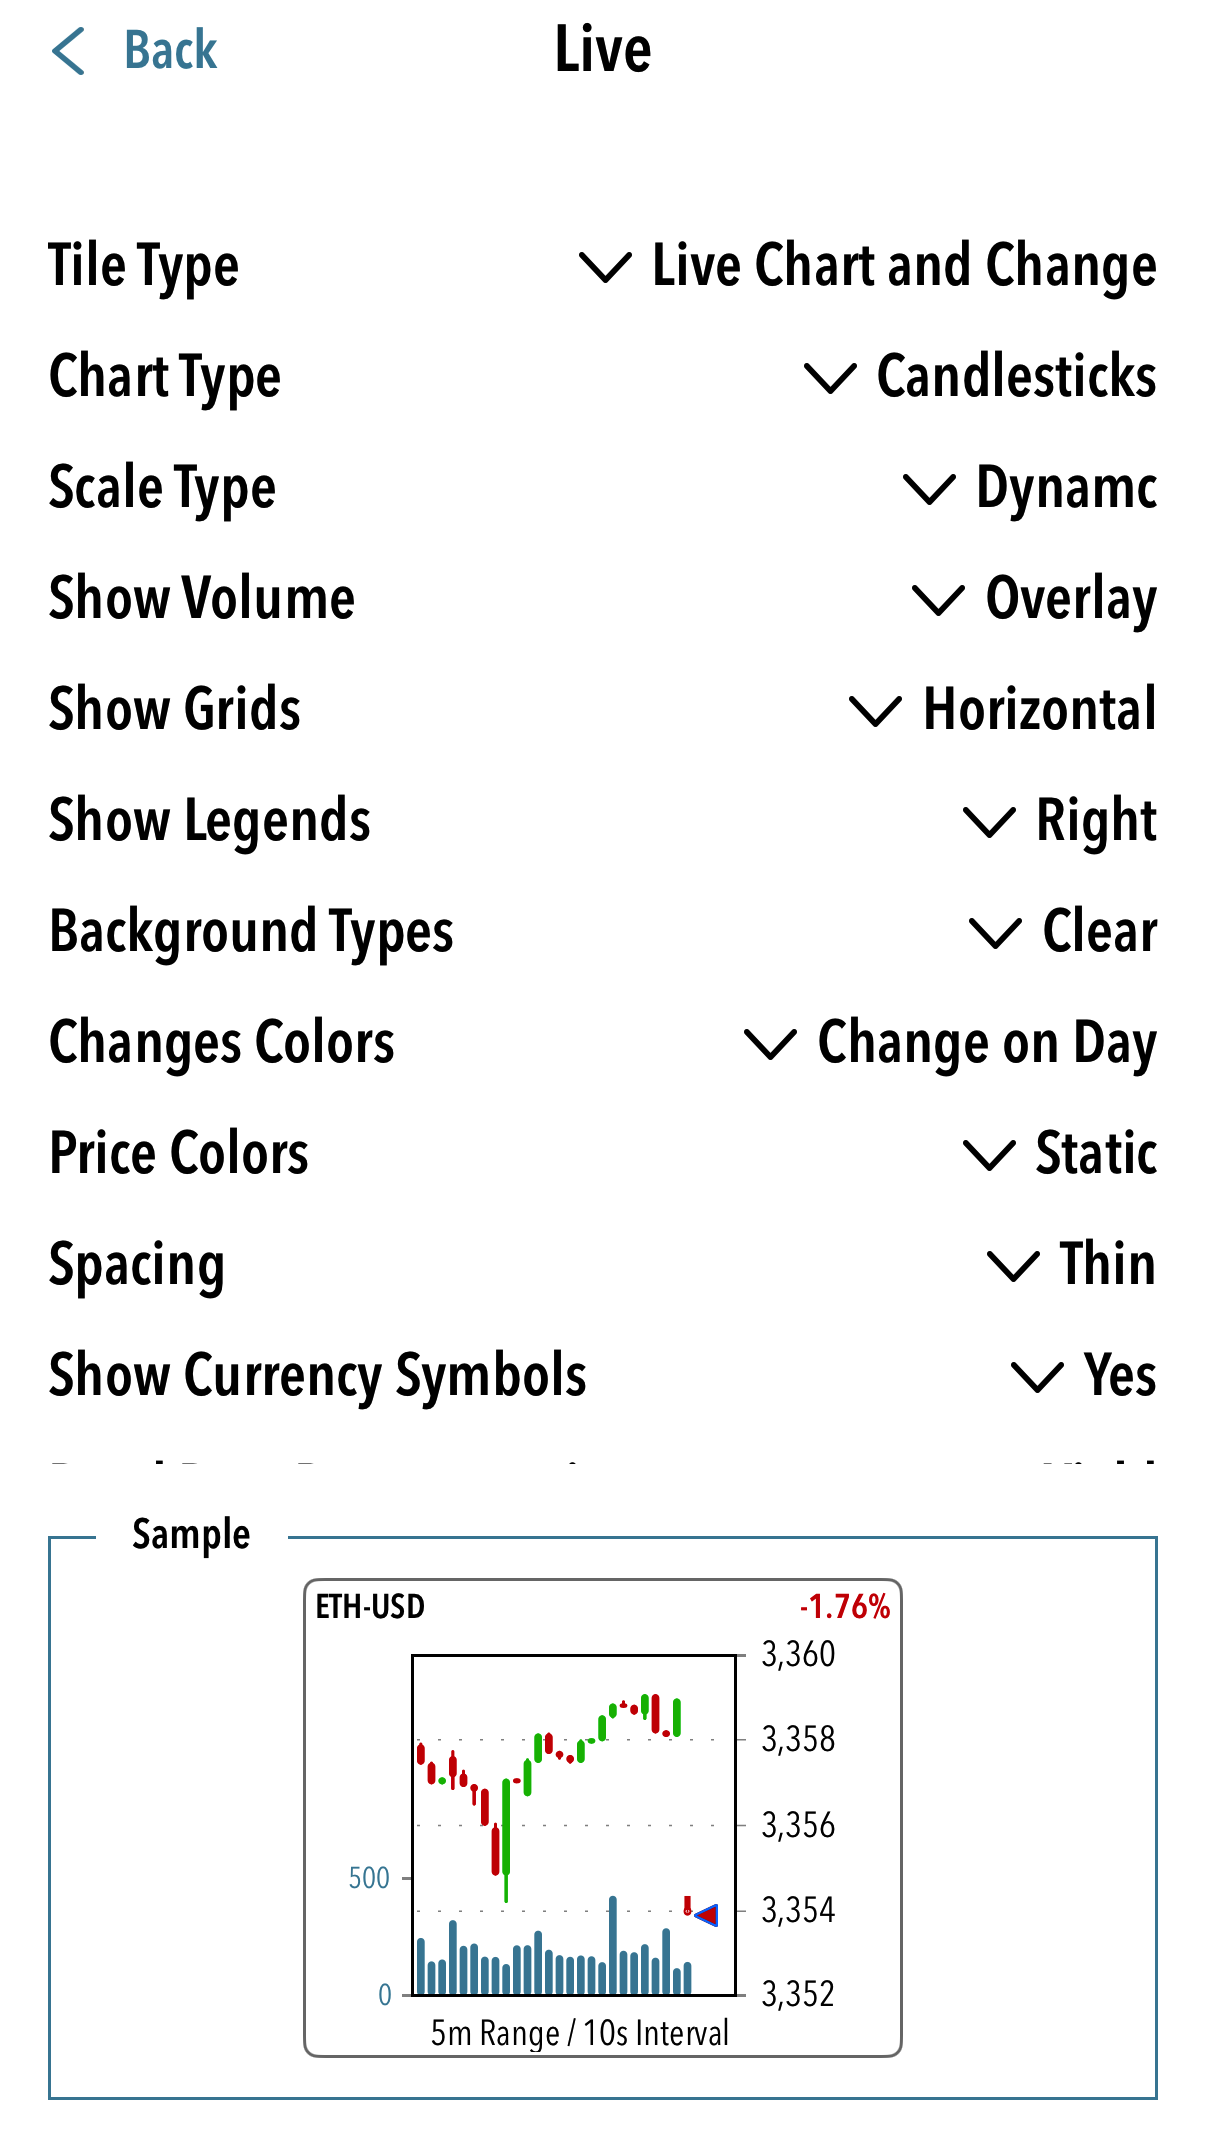
Tile Type
Chose which type of visualisatiion you prefer: several Tile styles are available as well as Live Charts and Table styles. As you change this setting, the menu adapts automatically to show the relevant paramenters and to show a sample of what the visualisation will look like
Chart Type
Chose which chart to display in those tiles with a real time chart: You can select a line chart or a candlestick chart
Scale Type
The Static scale is comprised between the high and low of all data recorded since the app started. The Dynamic scale is comprised between the high and the low of only the data displayed on the chart for the chosen interval period
Show Volume
Display shows the volume in an area separate from the price plot area. Overlay shows the volume in the same view as the price. Off doesn't not show the volume
Show Grids
Chose any combination of Horizontal and Tile Type grid or hide them
Show Legends
Chose the position for the price and volume scale labels. If volume is shown in its own views (Display) the volume labels are on the opposite side of the price labels
Background Type
Chose the background coloring of the Tiles or Live Charts:
Clear: No background color
Static: A neutral fixed color
Change on Day: a green or red background depending on the price change for the day
Graduated Change on Day: a green or red background with a varying intensity depending on the magnitude of the change for the day
Does not apply to the Table Mode
Changes Colors
Chose the coloring of the text displaying either the Absolute Change for the day in currency terms or the Percentage Change for the day for the Tiles or Live Charts:
Static: A fixed color
Change on Day: a green or red color depending on the price change for the day
Graduated Change on Day: a green or red color with a varying intensity depending on the magnitude of the change for the day
Warning: the interaction between Background Type and Changes Colors may render the changes not readable if using the same type for both (i.e. a Change on Day background color with a Change on Day color for the text will make the change text disappear in the background
Does not apply to the Table Mode
Price Colors
Chose the coloring of the text displaying the security Last Price field for the Tiles or Live Charts:
Static: A fixed color
Change on Day: a green or red color depending on the price change for the day
Follows Text Scheme: applies the same parameters as chose in Changes Colors
Does not apply to the Table Mode
Spacing
Sets the distance between Tiles or Tile Type on the page
Does not apply to the Table Mode
Show Currency Symbol
Shows the currency symbol for the security before the Last Price and Absolute Change fields
Bond Data Representation
Chose if you want Price or Yield in the tiles
Show Tools
Display or hide the Main Menu on the Live page
Tools Position
Sets the position on the screen of the Main Menu
Unlock Frequency Menus
By default the Chart Frequency and Chart Length menus are locked to avoid changing them unadvertedly as this would trigger a restart of the data collection for the charts and therefore loss of all the accumulated data. This switch unlocks the two menus after it
Chart Frequency
Chose the time interval represented for each bar on the Live Charts from 1 second to 1 hour
Chart Length
WARNING: CODING: CAN ONLY BE 1 HOUR AND CAN CHOSE IT SHORTES THAN FREQUENCY, LEADING TO CRASH. Glitch Menus not updating if I change Chart Frequency
Chose the amount of time represented by the Live Charts. Once this limit is reached, the charts will automatically slide to represent the last time period chosen

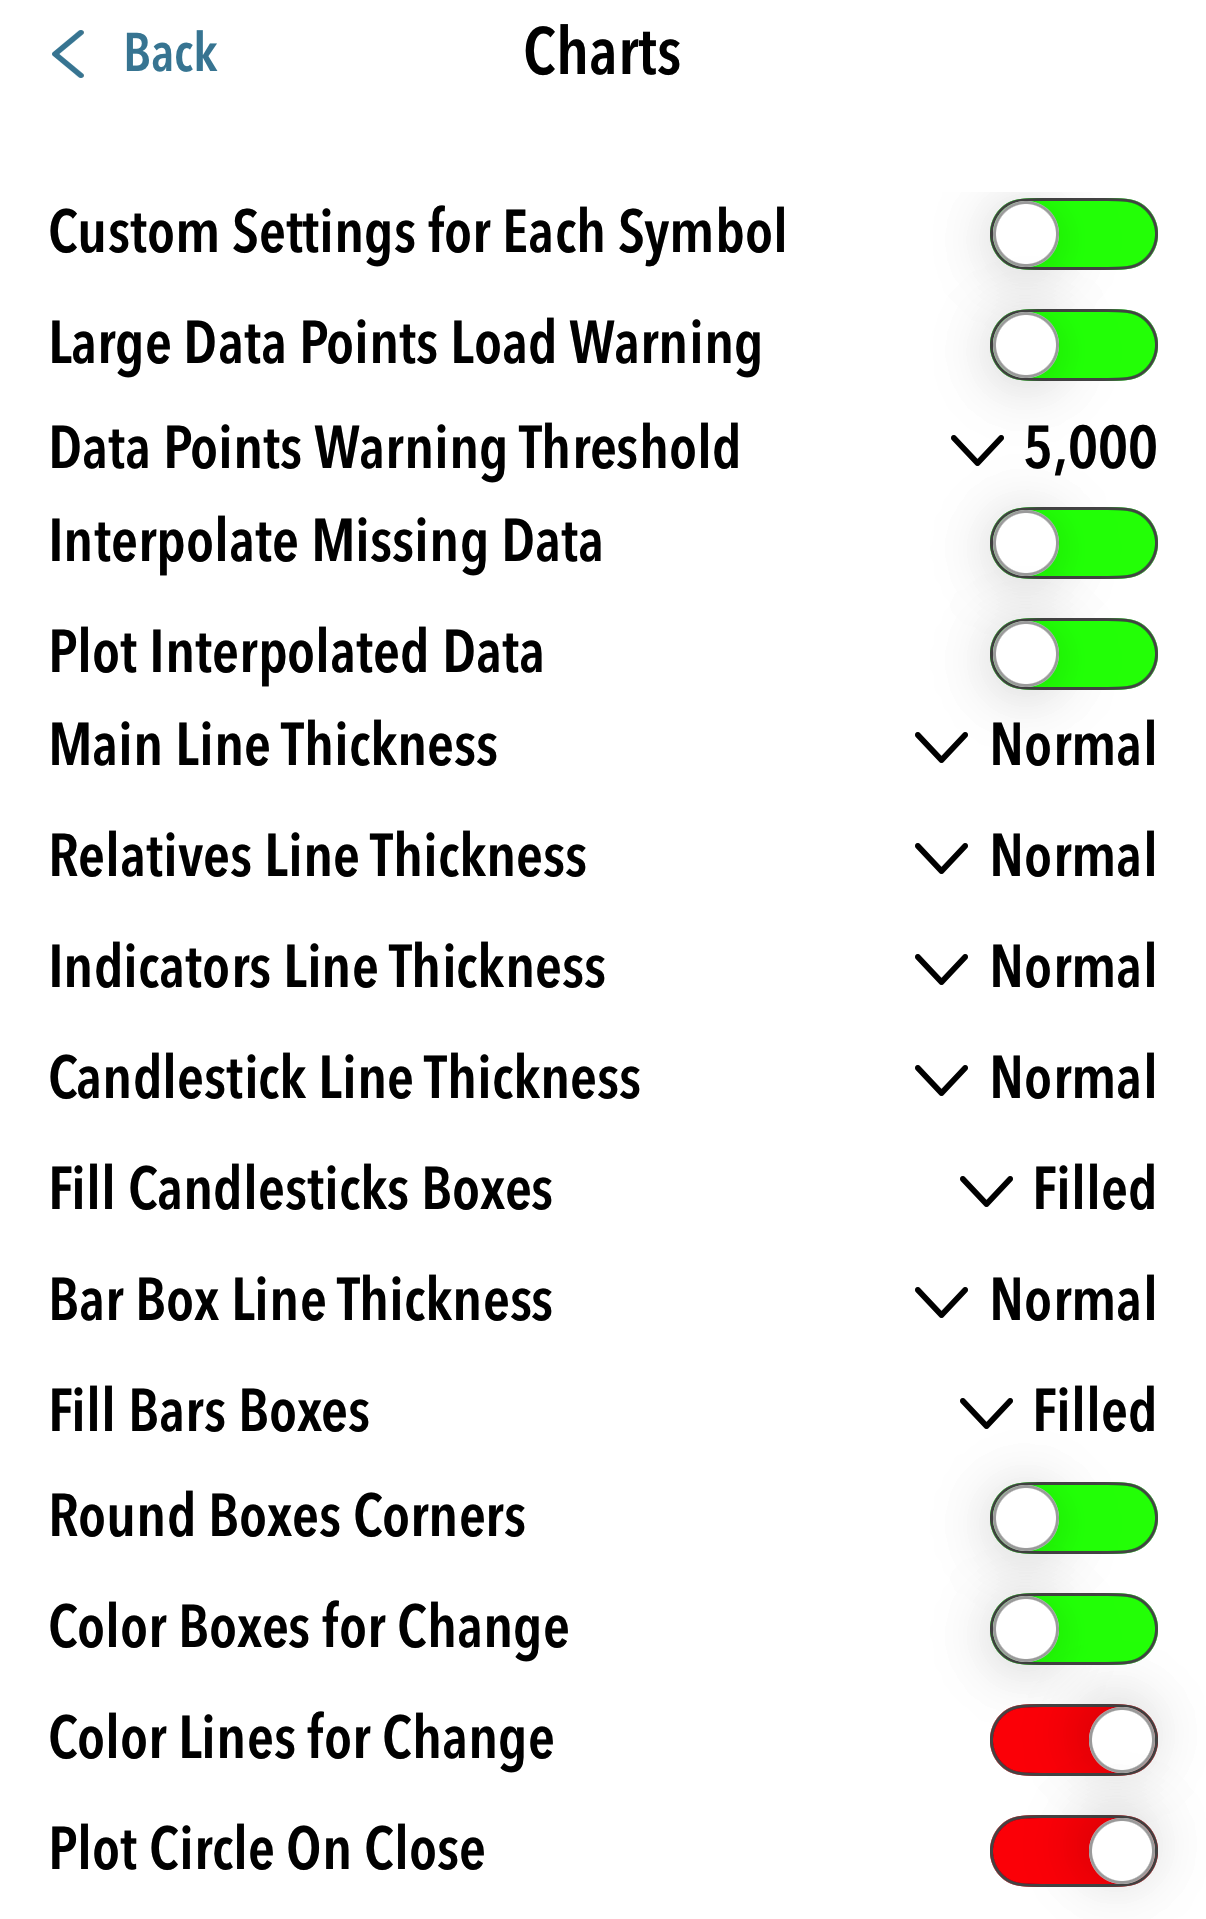
Custom Settings for Each Symbol
Chose if you want each symbol to have its own settings. If this option is on, each time you load a symbol, it will remember its own settings and load them. As you make changes to the chart for that symbol, these will be stored and associated to that symbol
Large Datapoints Warning
You can have a warning show up as you request to load a chart which had a large number of datapoints (as defined in the threshold set in the next setting. This is recommended depending on the performance of the device you are using. For example an intraday chart for 1 minute interval for 1 year with 3 relative securities can result in a very slow chart if run on an old device
Data Point Warning Threshold
Sets the number of datapoints that will trigger the Large Datapoints Warning
Interpolate Missing Data
Allows the use of interpolated data in case some are missing. This is particularly useful for relative securities which may have some data not matching the main security or for indicators
Plot Interpolated Data
Allows interpolated data to be plotted in the chart. The DataBox in the chart will show which data is interpolated
Main Line Thickness
Select the thickness of the main security line in the chart (Thin/Normal/Thick)
Relative Line Thickness
Select the thickness of the relative securities' lines in the chart (Thin/Normal/Thick)
Indicator Line Thickness
Select the thickness of the indicators' lines in the chart (Thin/Normal/Thick)
Candlestick Line Thickness
Select the thickness of the candelsticks' outside lines in the chart (Thin/Normal/Thick)
Fill Candlestick Boxes
Select how candlestick boxes will look like (Filled/Hollow)
Bar Box Line Thickness
Select the thickness of the Bar Boxes' outside lines in the chart (Thin/Normal/Thick)
Fill Bar Boxes
Select how the bar boxes will look like (Filled/Hollow)
Round Boxes Corners
Rounds the corners of candlestick or bar boxes
Color Boxes for Change
Fills the candlestick or bar boxes with color (up in green, down in red) depending on the change from the prior point
Color Lines for Change
Colors the lines from one point to the next one depending on the change from the prior point (up in green, down in red)
Plot Circle on Close
In line charts plots a circle around the Close for the point
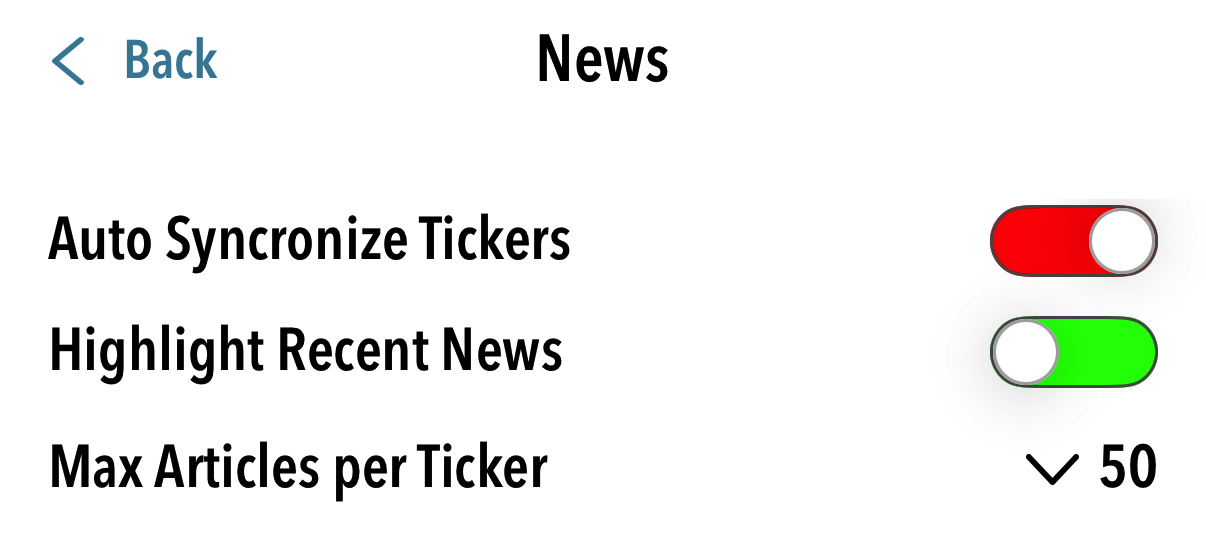
Auto Synchronize Tickers
[CODING: CHECK IF THIS WORKS] If the switch is on, any change made in one section is reflected in all the other sections. For example, adding a symbol in the News Section would also add the same symbol to the Live Monitor
Highlight Recent News
Displays the most recent news headlines (last 24 hours) in a highlighted color
Max Articles per Ticker
The maximum amount of article headlines to request for each symbol

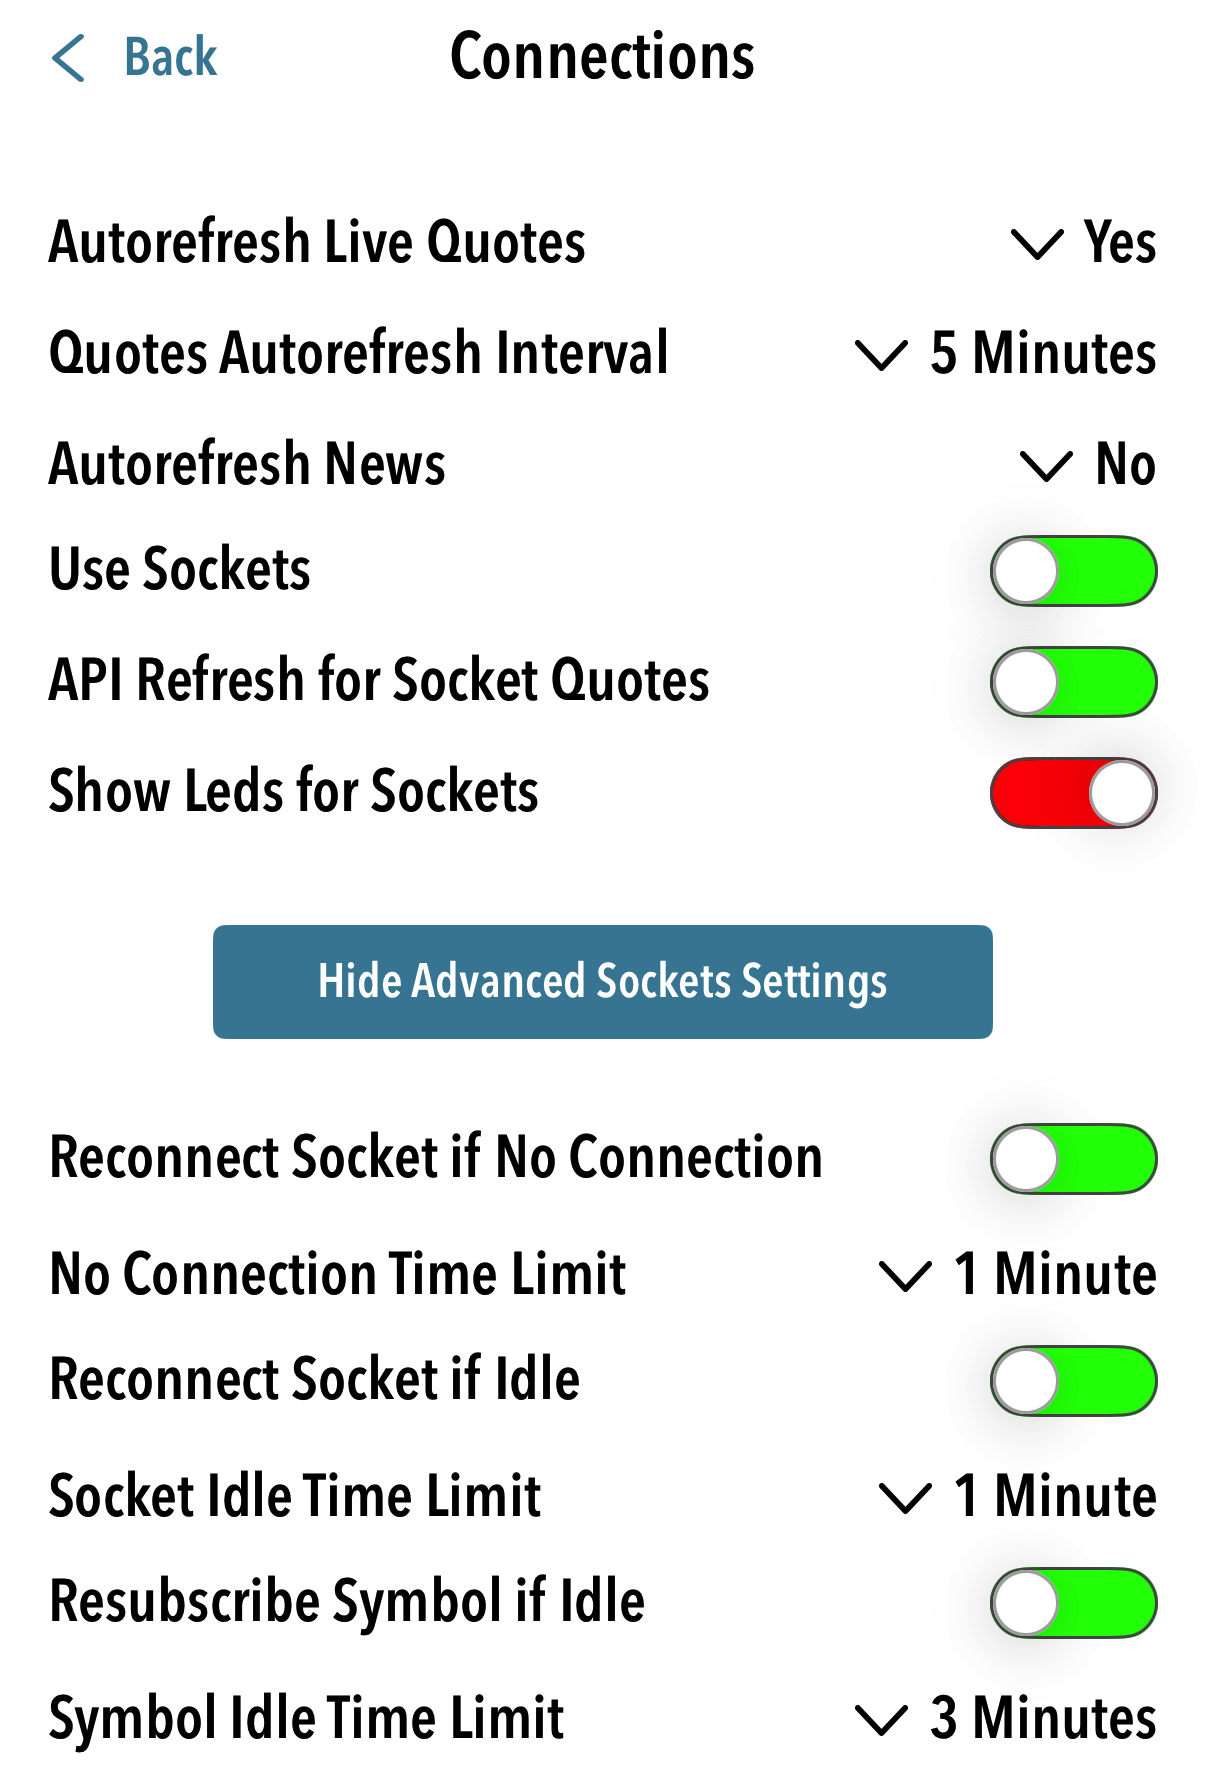
Autorefresh Live Quotes
Automatically refresh the quotes in the Live Section at fixed time intervals
Quotes Autorefresh Interval
Sets the timer for autorefresh
Use Sockets
Automatically open and manage web-socket for those securities supported by the data provider
API Refresh for Socket Quotes
Include those securities with web-socket support in static API refreshes
Show Leds for Sockets
Display a led next to the security symbol to show the web-socket and receive status
Show/Hide Advanced Sockets Settings
Shows (or hides) the advanced settings lines
Reconnect Socket if no Connection
Automatically tries to reconnect a websocket if there is no confirmed connection after a period of time set in No Connection Time Limit
No Connection Time Limit
The amount of time for the socket not to be connected before attempting a reconnection
Reconnect Socket if Idle
Automatically reconnect a socket if it has not received data for a period of time set in Socket Idle Time Limit
Socket Idle Time Limit
The amount of time for the socket not to receive data before attempting a reconnection
Resubscribe Symbol if Idle
If a symbol has not received quotes updates for a period of time as specified in Symbol Idle Time Limit, it will be resubscribed to. Note that on low liquidity securities or out of market hours this may trigger a number of resubscriptions
Symbol Idle Time Limit
The amount of time for the symbol not to receive quote updates before attempting a resubscription